Understanding Current Drivers of Nitrogen Losses
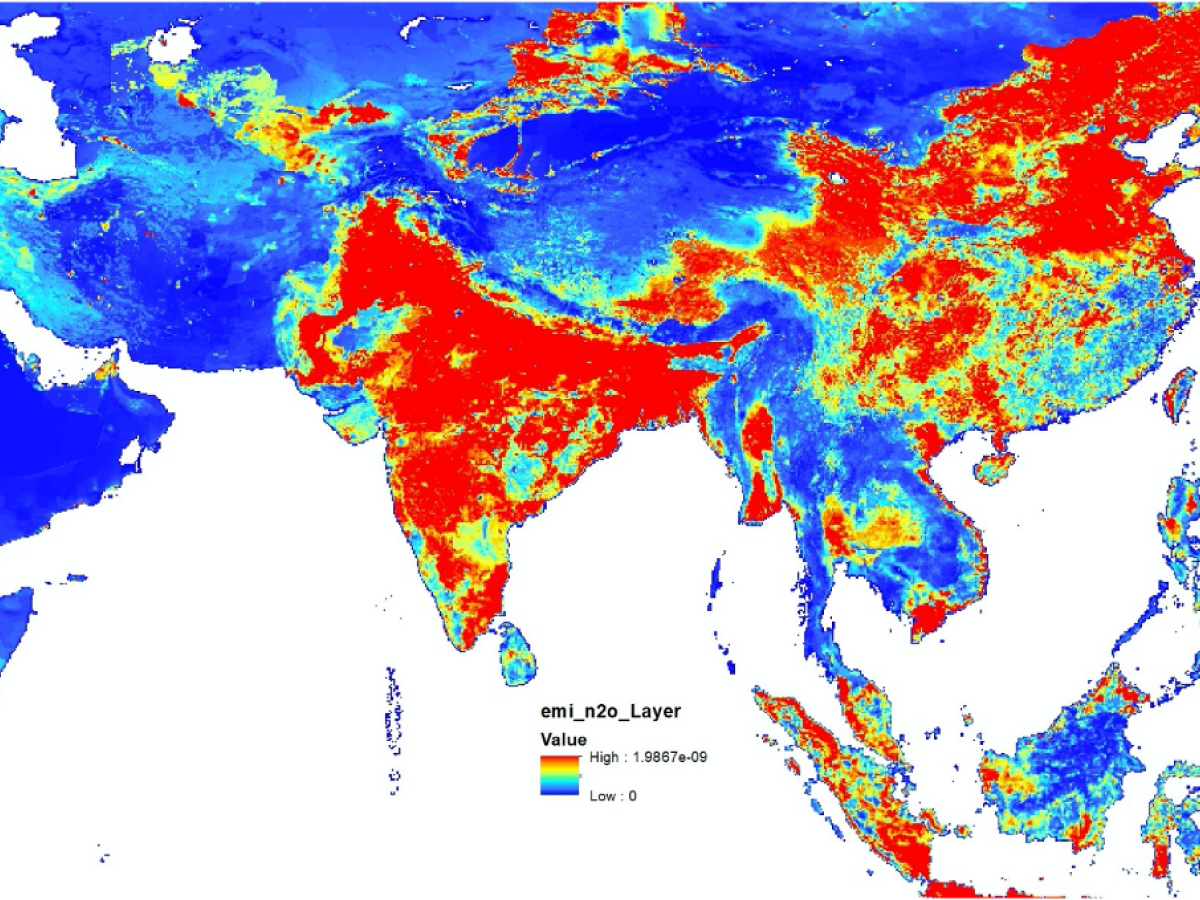
WP 1.2 have been using EDGAR time series emission data from 1970-2015 to identify the main sectors for all nitrogen species, to further understand the drivers of nitrogen pollution for every South Asian country. To ensure the validity of the results, WP 1.2 have also collected national datasets and used the information collected by the SACEP nitrogen questionnaires. WP 1.2 already have some very interesting results. In all countries except one, the biggest sector contributing to N2O emissions is from managed soil. Using the sector results, WP 1.2 have already been able to start to look at national differences such as indirect N2O emissions from atmospheric deposition being a larger contributor in countries such as the Maldives and Sri Lanka compared to Afghanistan and Bangladesh. This information, with the assistance of WP 1.1, can help inform policy-makers of the sectors in their country that could make the biggest impact by reducing nitrogen waste. WP 1.2 are also working hard to analyze sector-specific spatial maps for N2O emission to identify emission hotspots.
